

Share your Ideas Visually
This post looks at ‘Draw your Idea’ in practice- I’ll take a set of notes and show what sense can be made of the ideas that are contained - and what questions can be asked for the next set of visuals.
Reviewing a discussion about community building
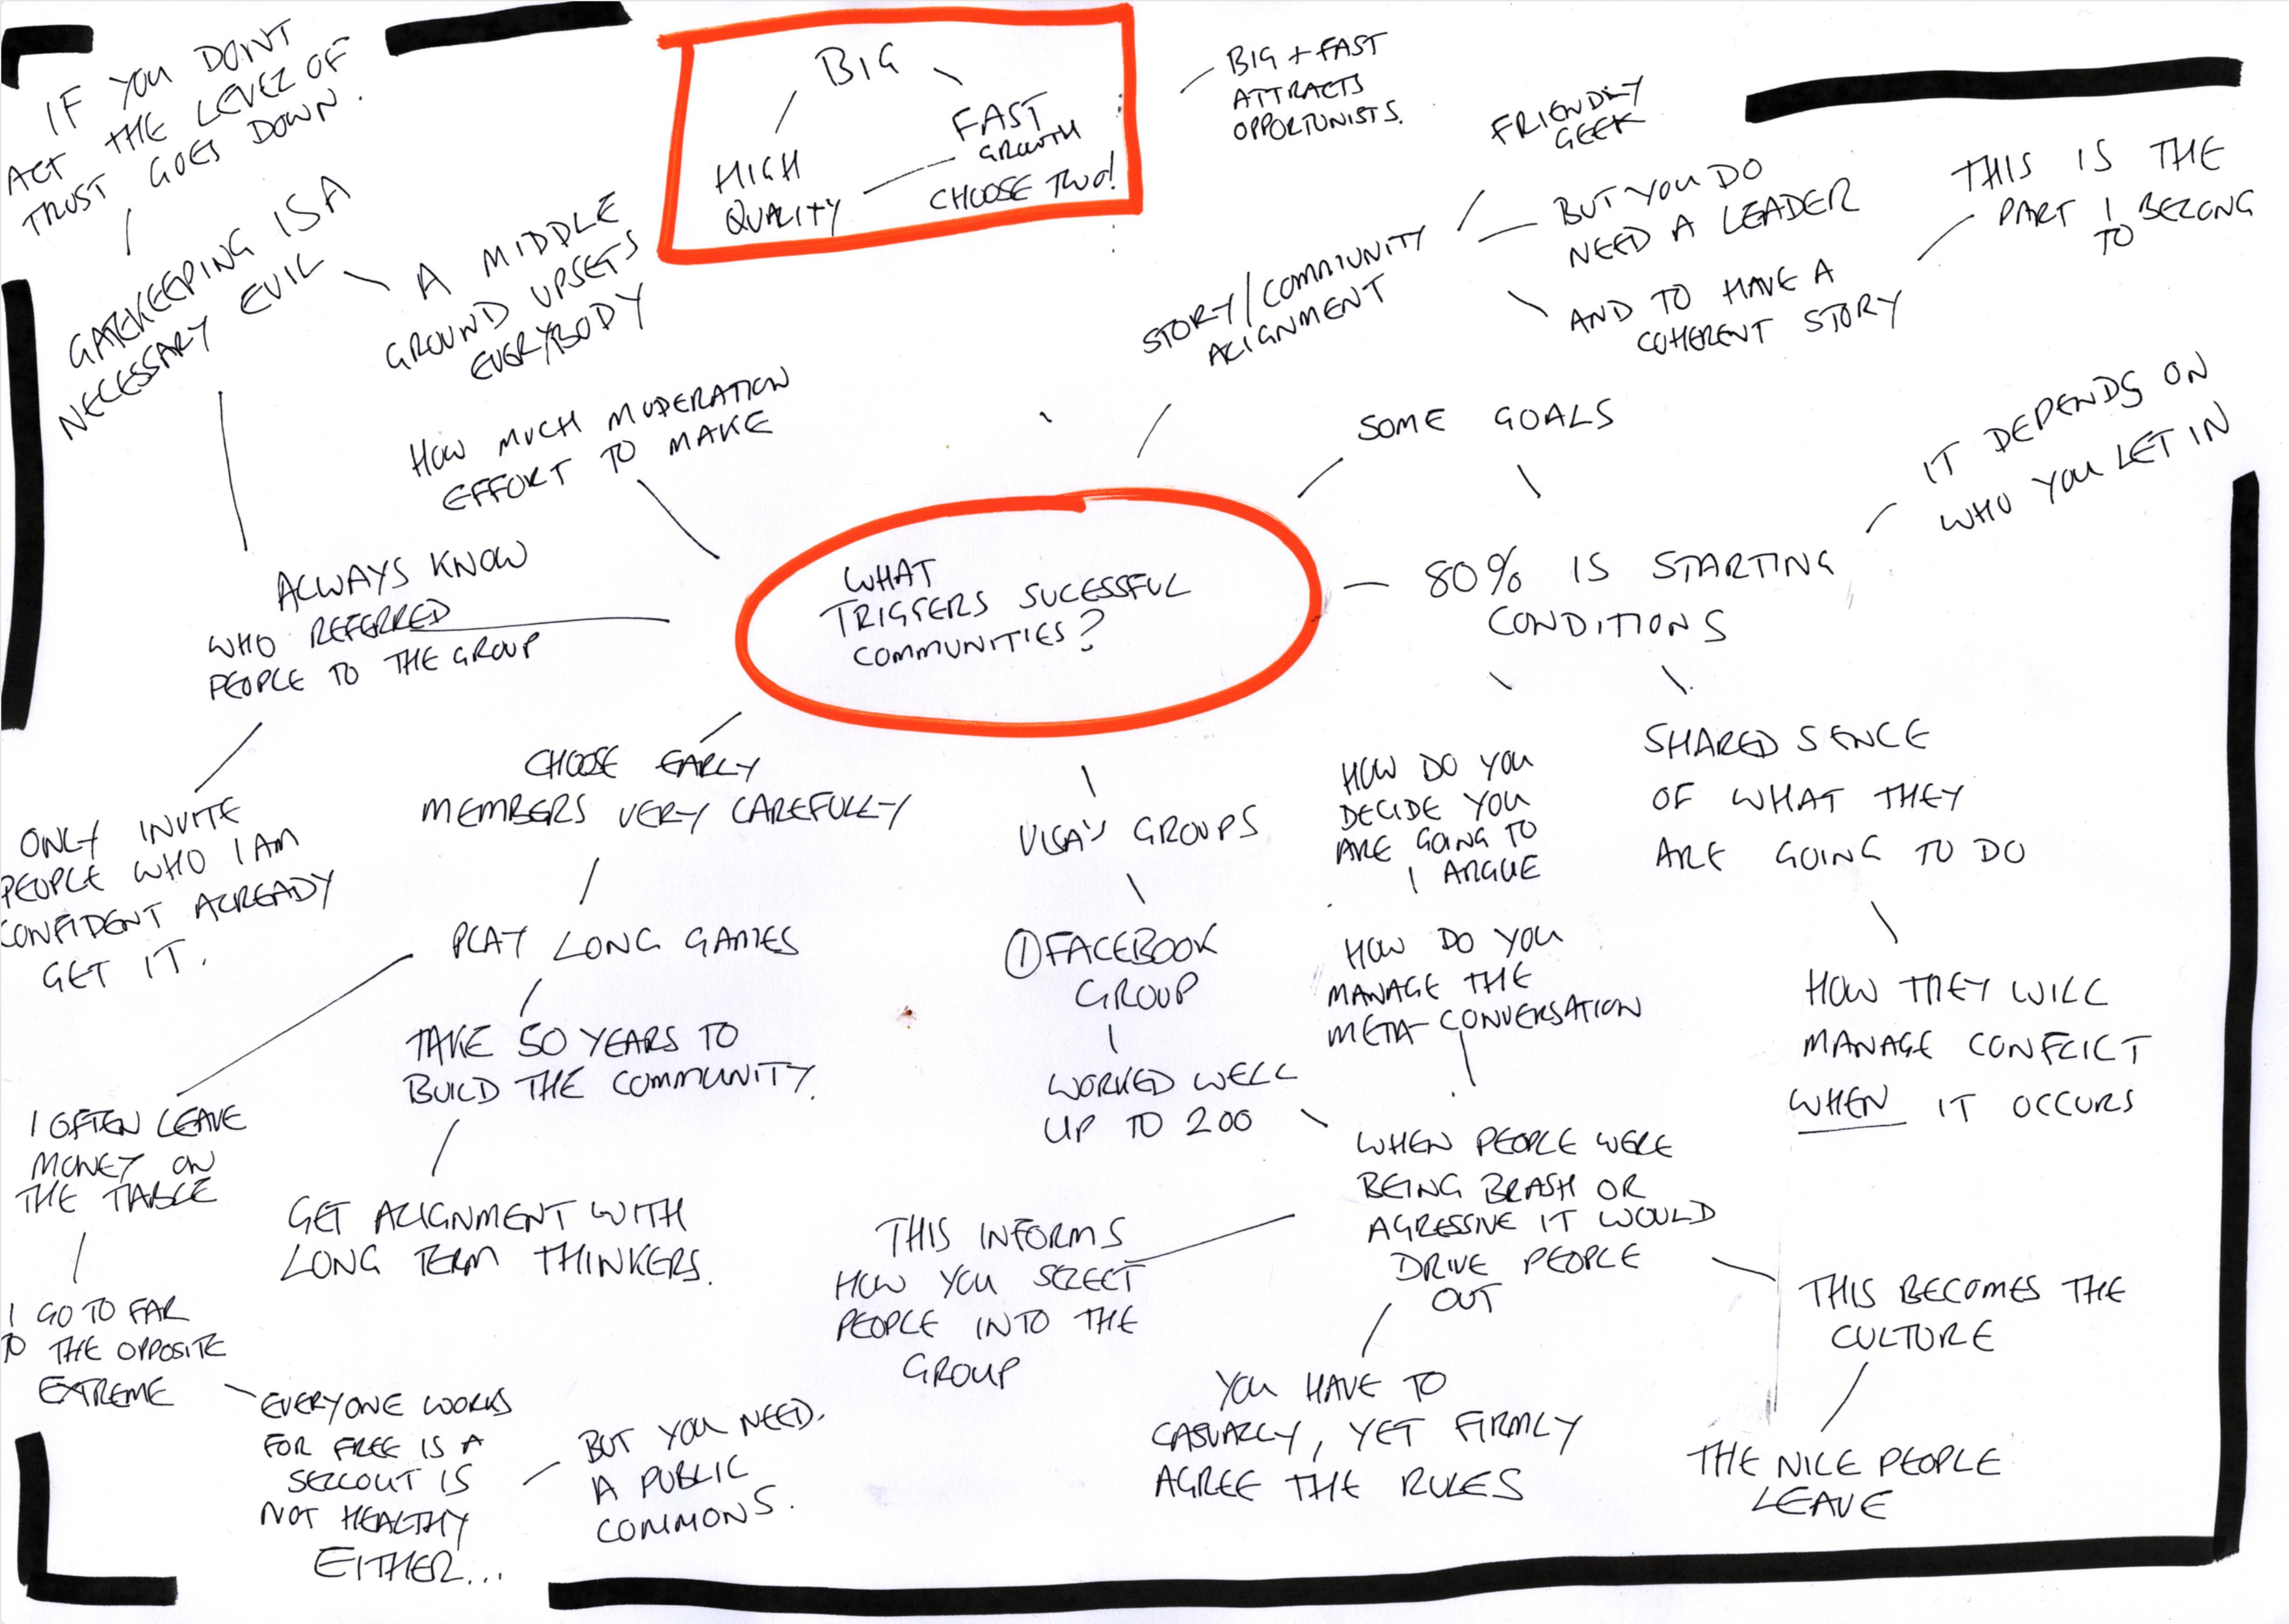
I’ve taken unstructured mess of notes from an online meeting about community building. I’ve used the process from ‘Draw your ideas’ to make sense of what was said, and move from a mess to something more legible and actionable. There are a few follow up questions that can be asked by pointing at the visuals and saying ‘what goes here?.
The original A3 notes are a bit overwhelming. If you were at the meeting you can make out things that were said and get a reminder of the discussion.
But it’s a big ‘Nope’ when we’re trying to share the ideas with people who might not have been there!
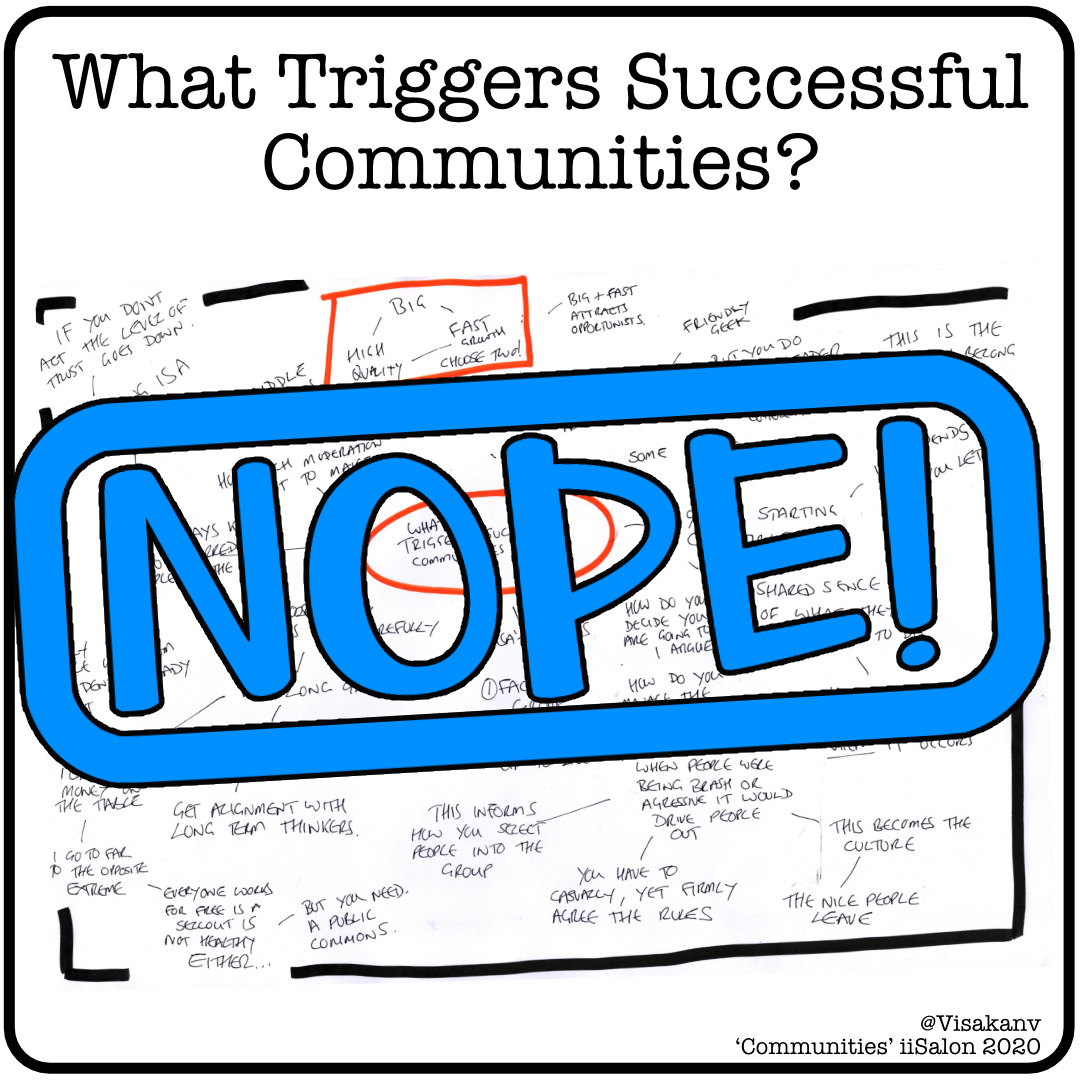
But we can get images that are useful to people who might not have been there. These also give us ideas for follow up questions that might not have been answered in the initial meeting.
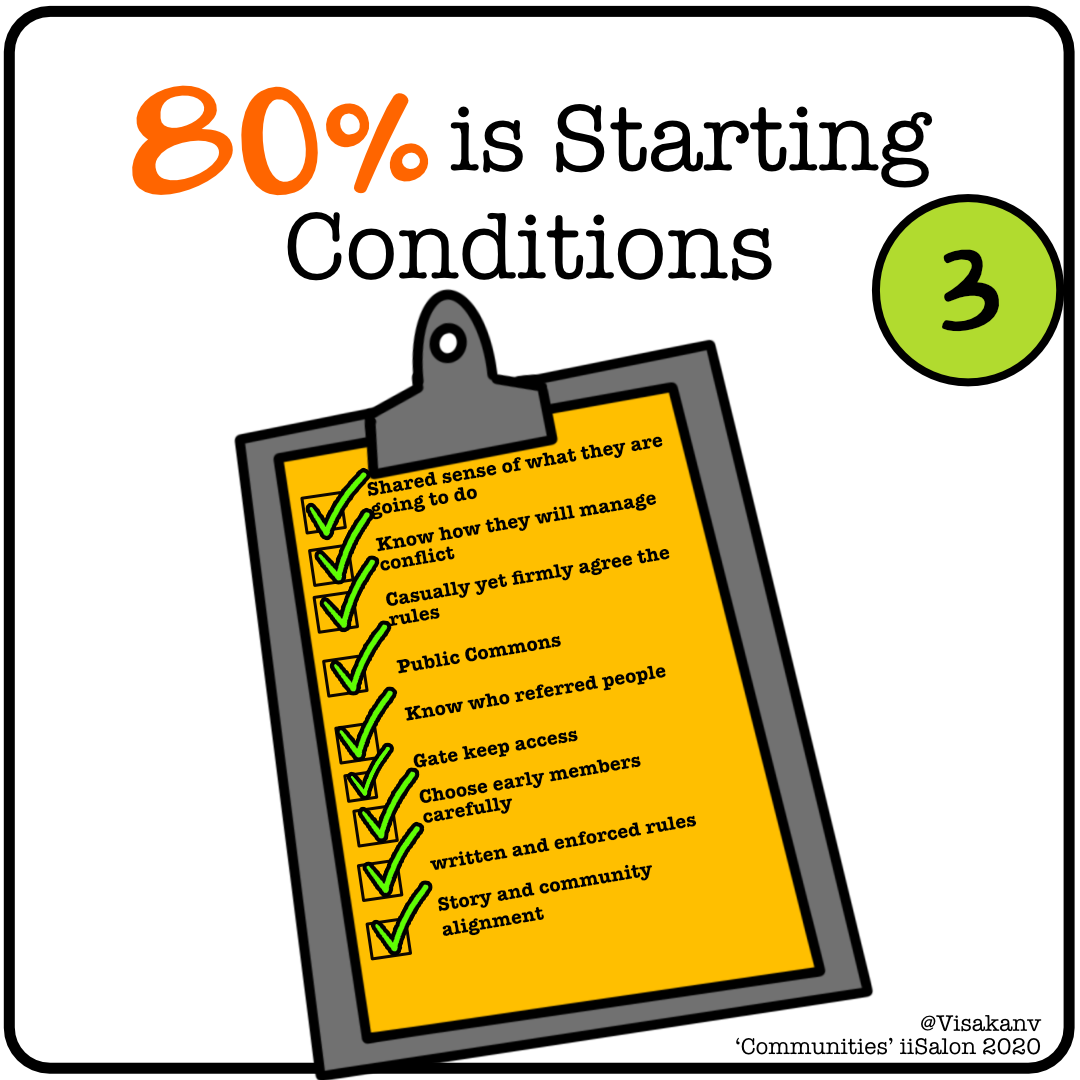
For example there is the following checklist for people starting a community is taken from the visual notes.
Drawing you ideas using lens 1
I’ve taken the image above and used some of the ‘Lenses’ from ‘Draw your ideas’. The first lens is looking at the connections between things. This diagram shows some of the ways things can be connected.
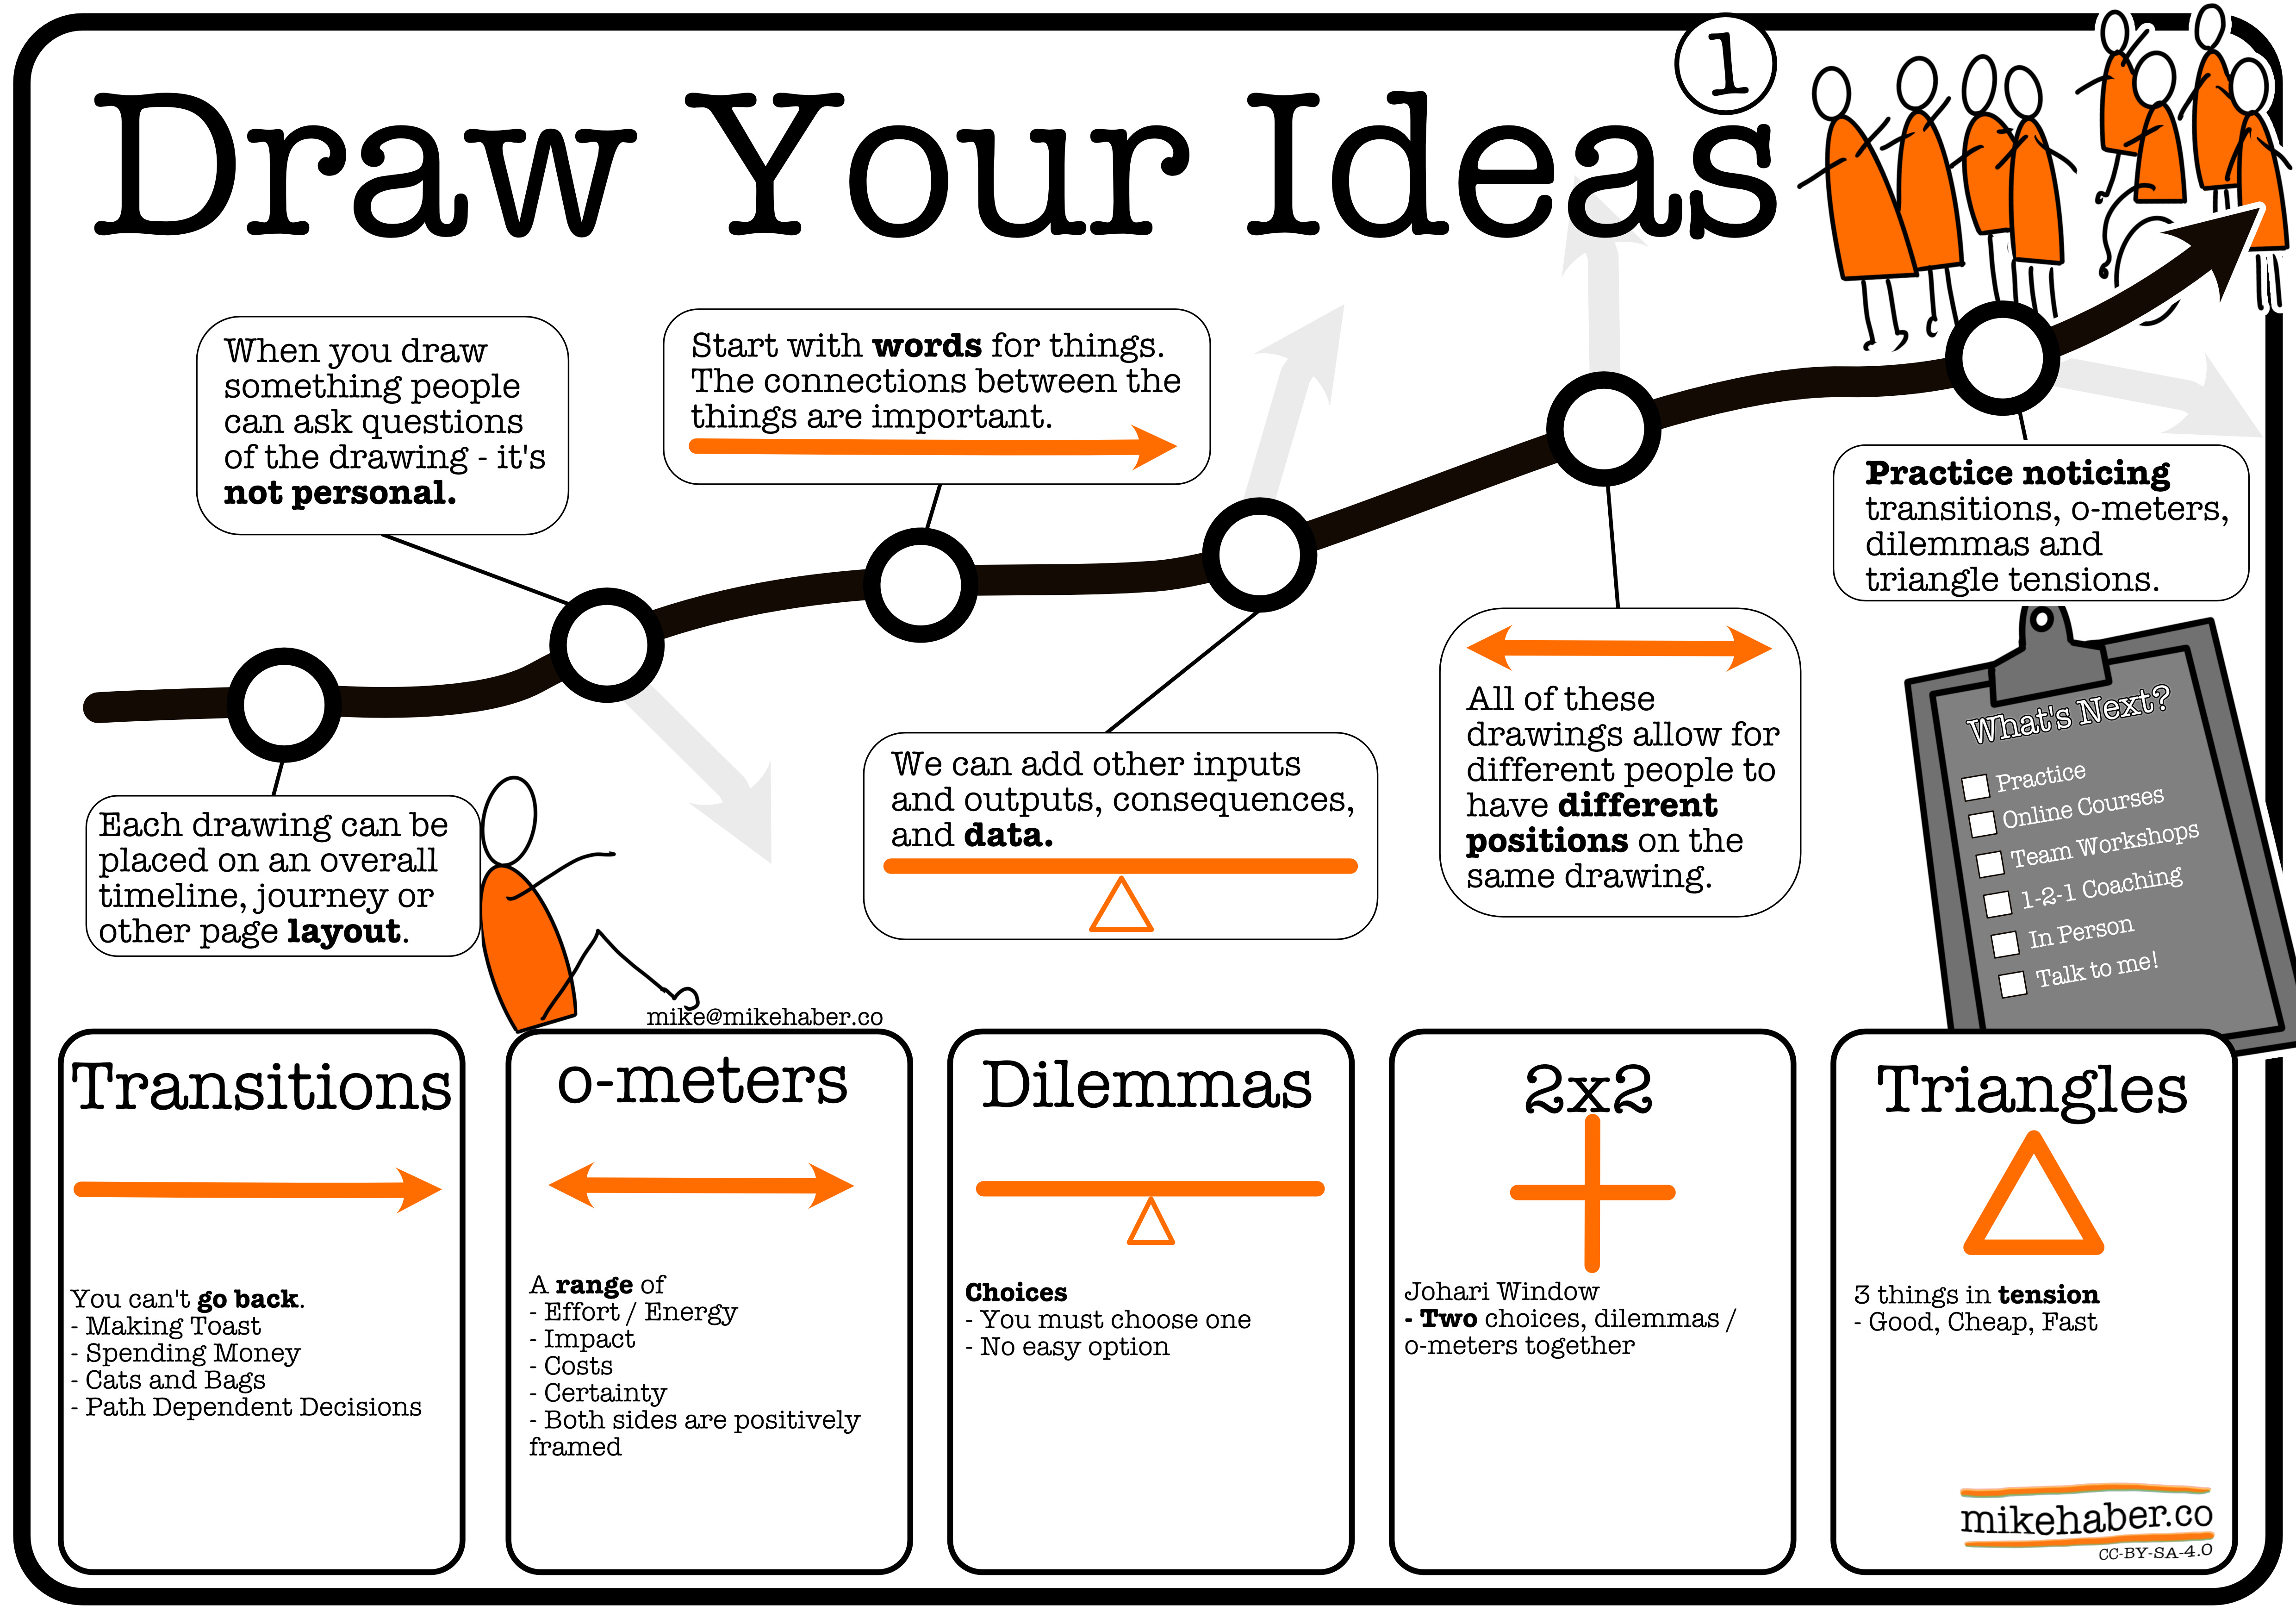
The first lens we can use to look at the notes says the connections between the words might be as important at the the words.
There are 5 things here
Transitions
Changes that happen and you can’t go back. Like adding milk to tea, spending the money you have or telling someone you don’t love them anymore. Things are not the same again, and you can’t just rewind.
O-Meters
There is a range of something. Like different amount of effort something might take. You can use an o-meter to show the different positions people may have on the scale.
Dilemma / Choices
There may be a choice you need to make between two things. You might want both options but you have to choose one.
2x2
We can create a 2x2 by putting o-meters, dilemmas or choices together. They are not guaranteed to be useful, but can highlight interesting things.
Triangles
If you have 3 things in tension, you can draw a triangle, and people can have their position somewhere inside the triangle. Good, Fast, Cheap is a well known tension in software. Another when talking about creative work might be ‘Interesting, Polished, Soon. (h/t
)The Process…
The process to create visuals from these notes was:
Copy the visual into Miro.
Link the Ideas using Lens1 ideas
This is the notes in Miro with idea added in red and numbered
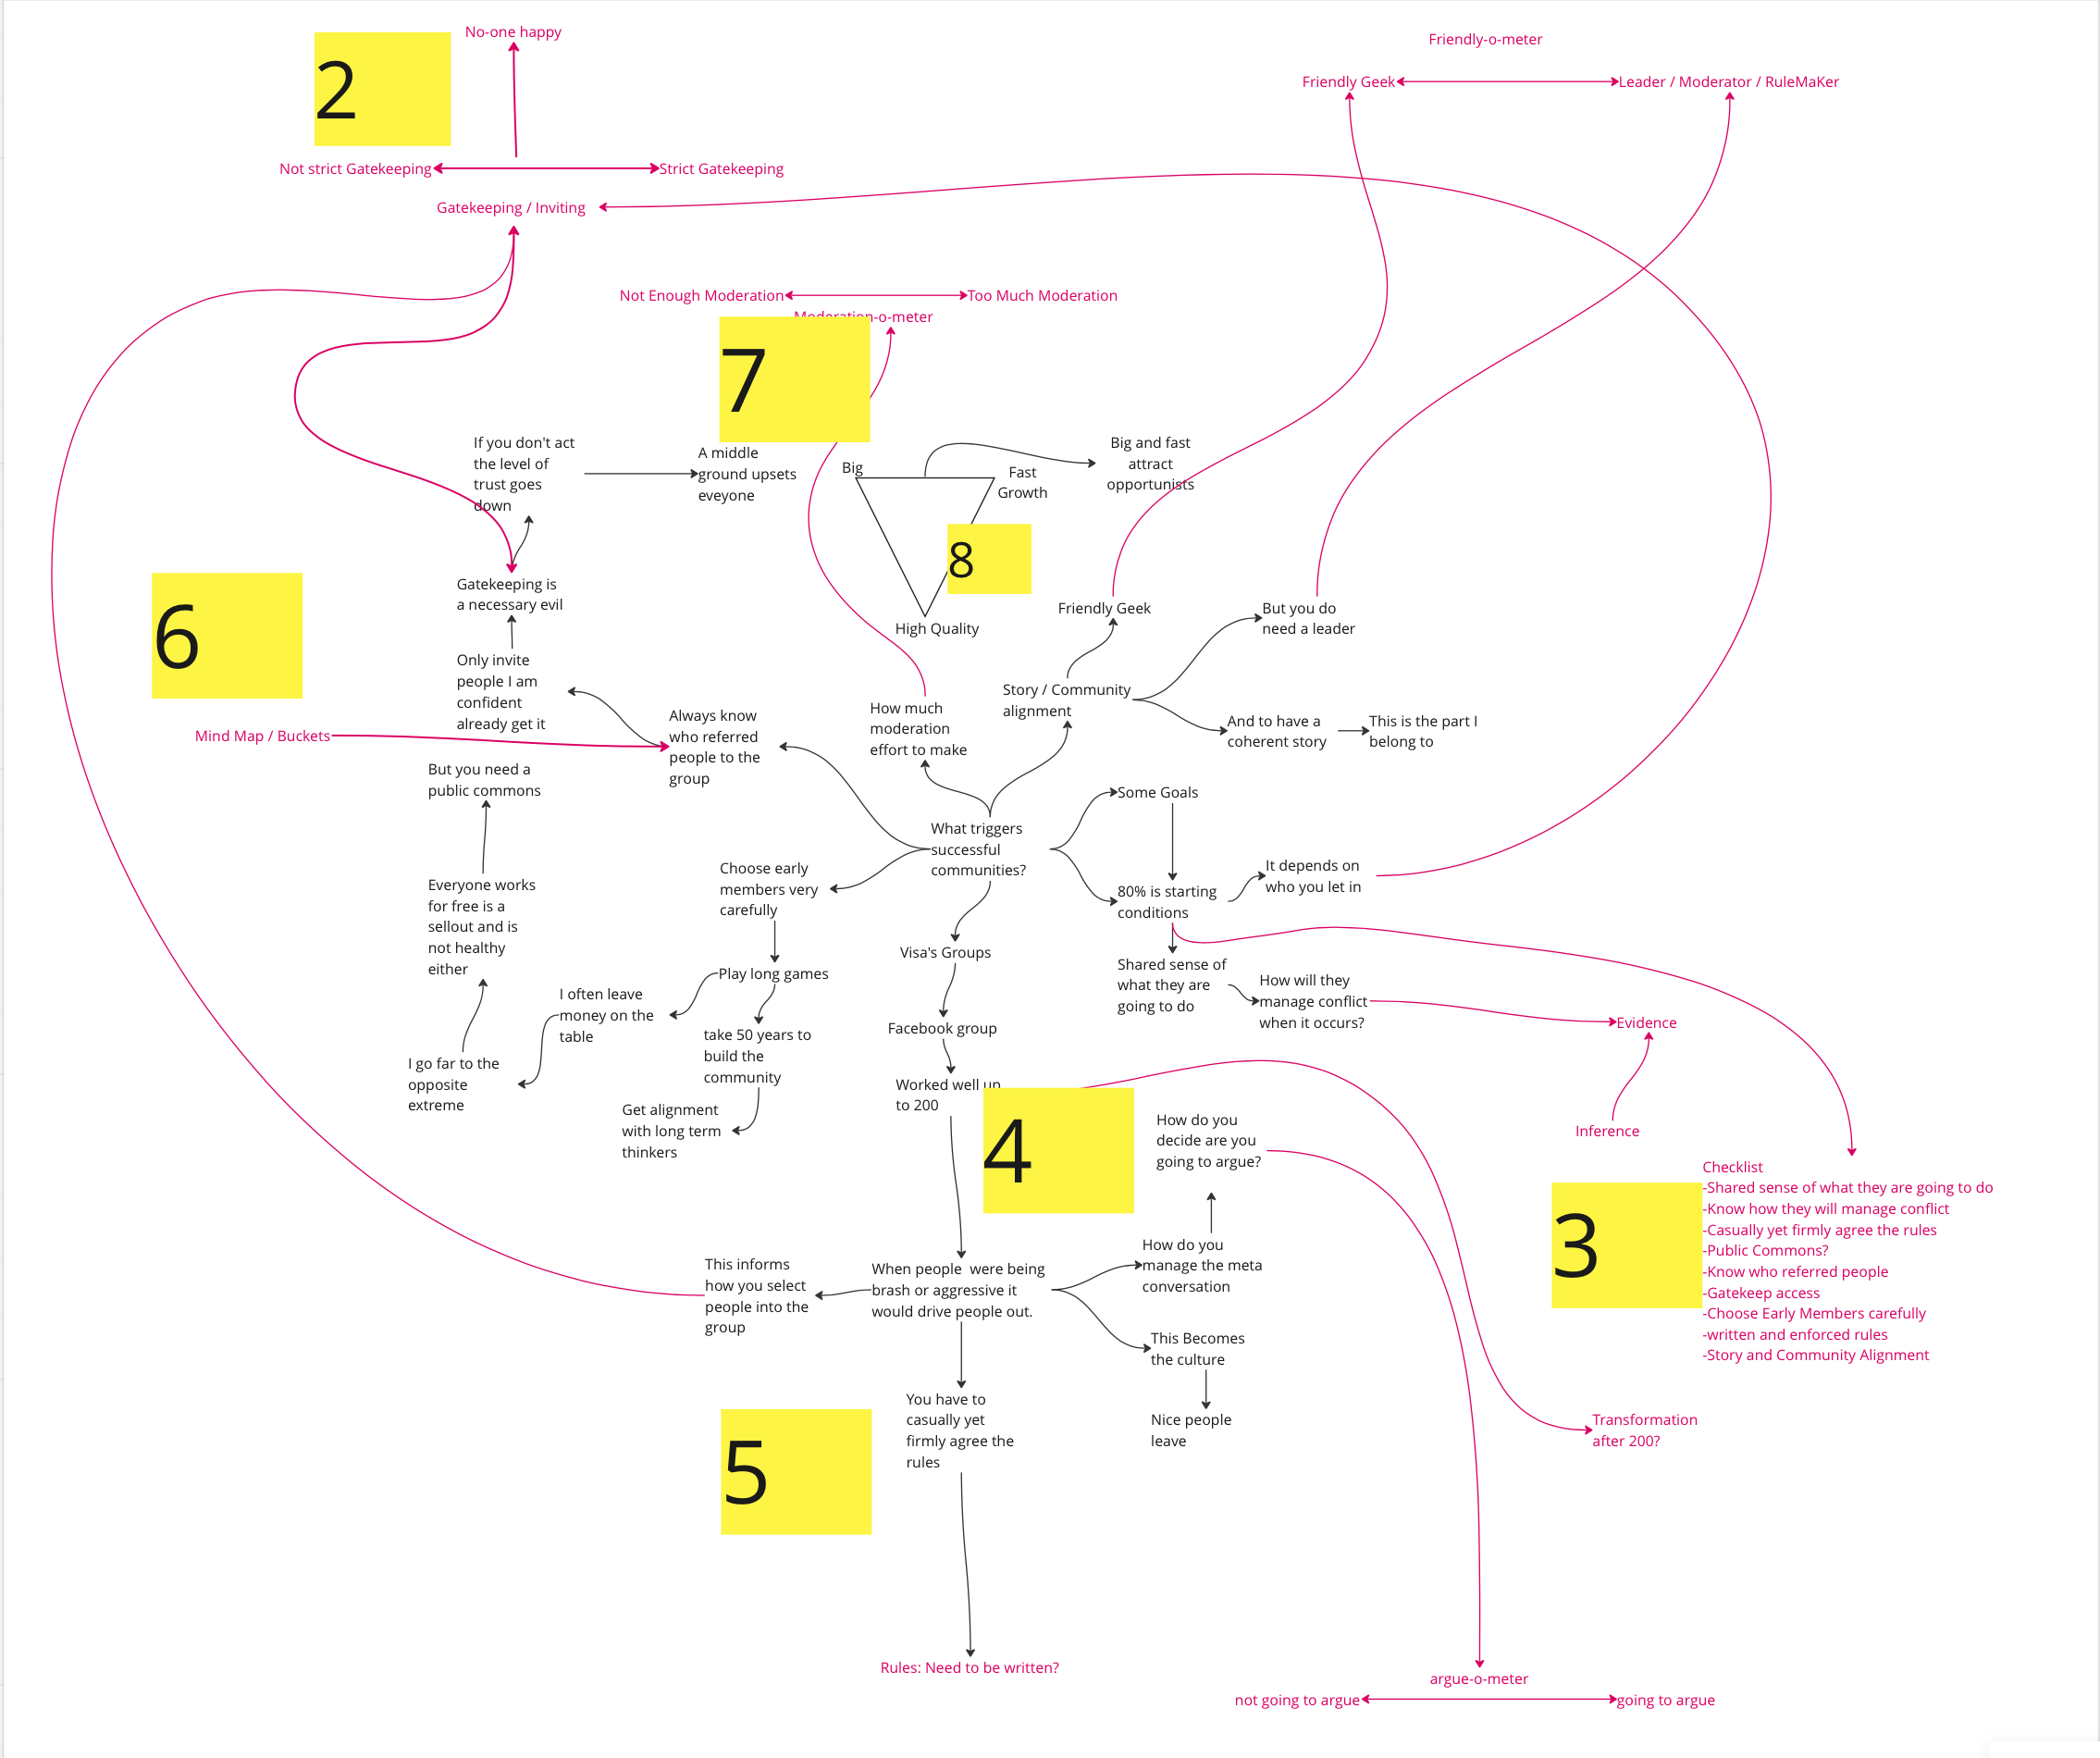
Drawing these items separately we get 8 visuals.
Tensions between a friendly geek and a leader
The necessary evil of gatekeeping
80% of success is starting conditions
A community worked well up to 200 members
Rules need to be written
Always know who referred people to the group
The dilemma of how much moderation to make
Tensions in community growth


From the original notes we can also create timelines, and use other lenses to make visuals that help to share what was discussed.
I’ve got questions..
These images raise some questions. And that’s a good thing. Asking ‘what would I see when there is too much moderation?’ or ‘Have you got an example of not enough moderation?’ are necessary if we want to take action on these ideas.
If the ‘Rules need to be written’ the next step is finding some written rules that have worked in the past or creating our own.
There are also some other Lenses we can use use to look at ‘Building Successful Communities’. These might look at how people experience the community. ‘What’s in it for me?’ or ‘How do I know this is community is working’.
Learning More
If you’re interested in learning more
Attend a ‘Draw your ideas’ workshop
Run a Team Workshop - where teams can make sense of their problems
Work with me 1-2-1 on your visuals
Sign up to my mailing list to find out about future workshops.
Book a chat about working we me and your team or 1-2-1.
Happy New Year, keep in touch!
Mike